In this tutorial, we are drawing Indian flag in Python.
If you enjoy learning from video, you can watch below video for this tutorial. Otherwise, continue with this blog.
Here we are using two Python modules.
We can divide the problem of drawing the flag into three sub-tasks.
Drawing color strips and and Ashok Chakra circle is very easy.
For drawing the spokes inside the Ashok Chakra you need to perform some mathematical calculations that’s where we are using the NumPy module.
Numpy is a very important Python module used in Data Analytics. You can learn more about it.
Here is the complete code to draw the Indian flag in Python.
import numpy as np
import matplotlib.pyplot as py
import matplotlib.patches as patch

#Plotting the tri colours in India flag
a = patch.Rectangle((0,1), width=12, height=2, facecolor='green', edgecolor='grey')
b = patch.Rectangle((0,3), width=12, height=2, facecolor='white', edgecolor='grey')
c = patch.Rectangle((0,5), width=12, height=2, facecolor='#FF9933', edgecolor='grey')
fig, ax = py.subplots()
ax.add_patch(a)
ax.add_patch(b)
ax.add_patch(c)

#Drawing AshokChakra Circle in the middle
radius=0.8
py.plot(6,4, marker = 'o', markerfacecolor = '#000088ff', markersize = 9.5)
ashikChakra = py.Circle((6, 4), radius, color='#000088ff', fill=False, linewidth=7)
ax.add_artist(ashikChakra)

#Adding 24 spokes in AshokChakra
for i in range(0,24):
   p = 6 + radius/2 * np.cos(np.pi*i/12 + np.pi/48)
   q = 6 + radius/2 * np.cos(np.pi*i/12 - np.pi/48)
   r = 4 + radius/2 * np.sin(np.pi*i/12 + np.pi/48)
   s = 4 + radius/2 * np.sin(np.pi*i/12 - np.pi/48)
   t = 6 + radius * np.cos(np.pi*i/12)
   u = 4 + radius * np.sin(np.pi*i/12)
   ax.add_patch(patch.Polygon([[6,4], [p,r], [t,u],[q,s]], fill=True, closed=True, color='#000088ff'))

py.axis('equal')
py.show()
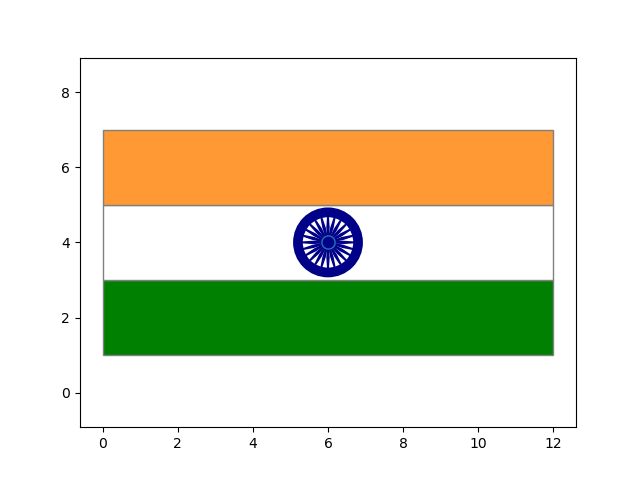
This is just a small program and you can visualize the Indian flag as output.
Before executing this Python program, make sure you have Numpy and Matplotlib library installed on your system.
If not, you can install them using Python pip tool.
Command for installing Numpy module:
pip install numpy
Command for installing Matplotlib module:
pip install matplotlib
Output:
Save the above program in the Python file (says flag.py) and execute it.
python flag.py
Plotting the Indian flag in Python is not the only intention here. This tutorial is about learning different methods and sub modules in the matplotlib library.
NumPy and Matplotlib libraries are the two of the most used Python libraries in Data Science.
You can also use the Turtle Python module for drawing.
There are many amazing things you can do with just few lines of Python code. Python is very interesting. Keep learning Python.
Any query? Let me know in the comment.

I am a Python enthusiast who loves Linux and Vim. I hold a Master of Computer Science degree from NIT Trichy and have 10 years of experience in the IT industry, focusing on the Software Development Lifecycle from Requirements Gathering, Design, Development to Deployment. I have worked at IBM, Ericsson, and NetApp, and I share my knowledge on CSEstack.org.